
What is heart rate variability and what does it mean?
Heart rate variability is the variation in the spaces between heart beats. For example, you may have a heart rate of 60 beats per minute (bpm), but this doesn’t mean your heart is beating uniformly once every second. The variation in heart rate timing is due to the continual balancing act between the sympathetic nervous system and the parasympathetic nervous system.
The sympathetic nervous system is responsible for the fight or flight response. When this system is dominant, it indicates that you are under a high level of stress. A dominant sympathetic nervous system results in LOWER heart rate variability.
The parasympathetic nervous system is all about eating and sleeping and recovery. If this system is overly active, indicated by unusually ELEVATED heart rate variability, it means you are in recovery and repair mode.
Each person has their own optimal heart rate variability range, when the sympathetic and parasympathetic systems are in balance and you are primed to handle more stress (aka hard training!). Heart rate variability outside of your optimal zone (too low or too high) indicates you may be experiencing stress.
How do you measure heart rate variability?
We now have the technology to accurately measure heart rate variability (hrv) in the comfort of our own home on a daily basis. This is best done using a chest heart rate strap that will send data to your phone (via Bluetooth or ANT+ if this is possible on your phone). The Polar H7 chest strap has been shown to be accurate for measuring hrv, and this is the one I use. Whatever you choose, you need to make sure it measures hrv and can connect to your phone as you’ll need to connect it to your hrv app to view and interpret the data. Here is more info about compatible heart rate straps and whether your phone is ANT+ compatible.
I use the Elite hrv app. I like it because it is geared towards athletes. It is straightforward to use and gives me enough data to understand my hrv balance each day. It is also soon going to allow syncing with Training Peaks, which means better tracking of training stress and overall stress in one place, and the ability for me to see hrv data for my athletes.
Heart rate variability is best measured in the same circumstances every day, to minimise any external factors that may impact on variability. I measure mine first thing in the morning – get up, go to the toilet, put on the heart rate strap, and lie back in bed to take the reading. The reading is 2.5 min (in the Elite hrv app) and it is a good way to evaluate where I am at before starting the day.
Interpretation via the Elite HRV app
This section talks about my experience in hrv measurement and interpretation, which relates to the Elite hrv app. I don’t have experience with other apps so I can’t comment on how they work or if they are any better, but the principles should be similar. Elite HRV was one of the few apps available on Android as well as iOS at the time when I started using it, and it is free!
Interpretation of hrv is all about establishing your normal/ optimal range, and comparing your result each day to that range. So to get the most out of it, you really need to take the measurement each day. The app will use your data to determine your baseline, which it will review and adjust on a daily basis. It will also tell you your average hrv for that day, give you a score out of ten, and indicate your position on a coloured meter, as per the picture below. You can see that my hrv on this day was 63 – which was higher than yesterday (57), way higher than my recent baseline (52) and higher than my lifetime baseline (54). It was way outside of my normal range, so it was a red day for me! Note that these scores for hrv are not in beats per minute – each app uses their own transformation of the data to come up with a single number. For Elite HRV, this is a number between 0 and 100 for ease of understanding.
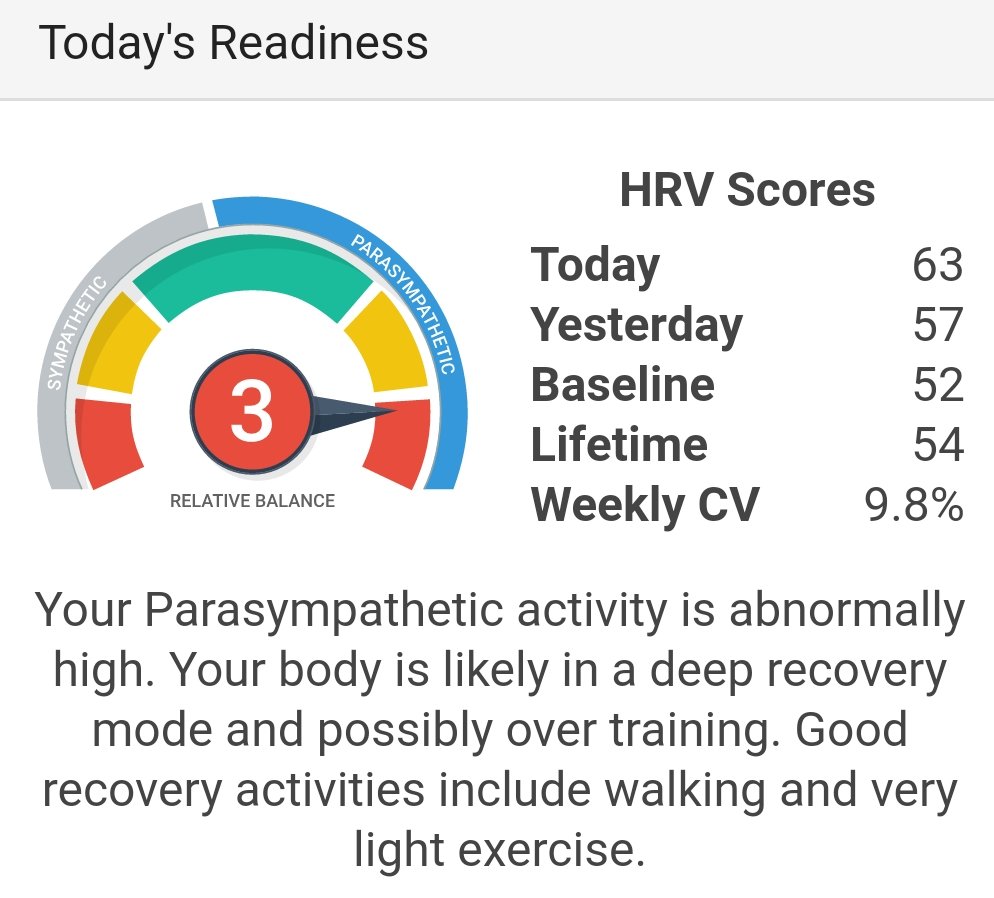
You can see that the meter has a green zone in the middle (higher scores closer to ten) and red zones on each side corresponding to elevated sympathetic or parasympathetic nervous system.
Green zone = you can train hard and handle high stress, optimal hrv zone.
I typically get a lot of days in the green zone. I could probably be training harder more often than I am ….
Yellow zone = I generally get yellow on the sympathetic dominant side, which indicates higher stress levels. For me, this tends to happen on the second day after a high intensity interval session. If I get one yellow day, I know I can train through it. Or sometimes I’ll decide to do a lower intensity session but make it a long session so I’m still getting a workout.
I’ve had a few times when I’ve had a block of yellow and lower hrv for a week in a row, in spite of not training hard and not being able to identify a specific source of stress. These have been periods when I’ve felt fatigued for no reason and I knew that I was run down, fighting a cold, or generally stressed out. By paying attention to my hrv, I’ve managed to keep from getting sick by reducing my training stress, trying to get extra sleep and do relaxation activities like meditation during these times.
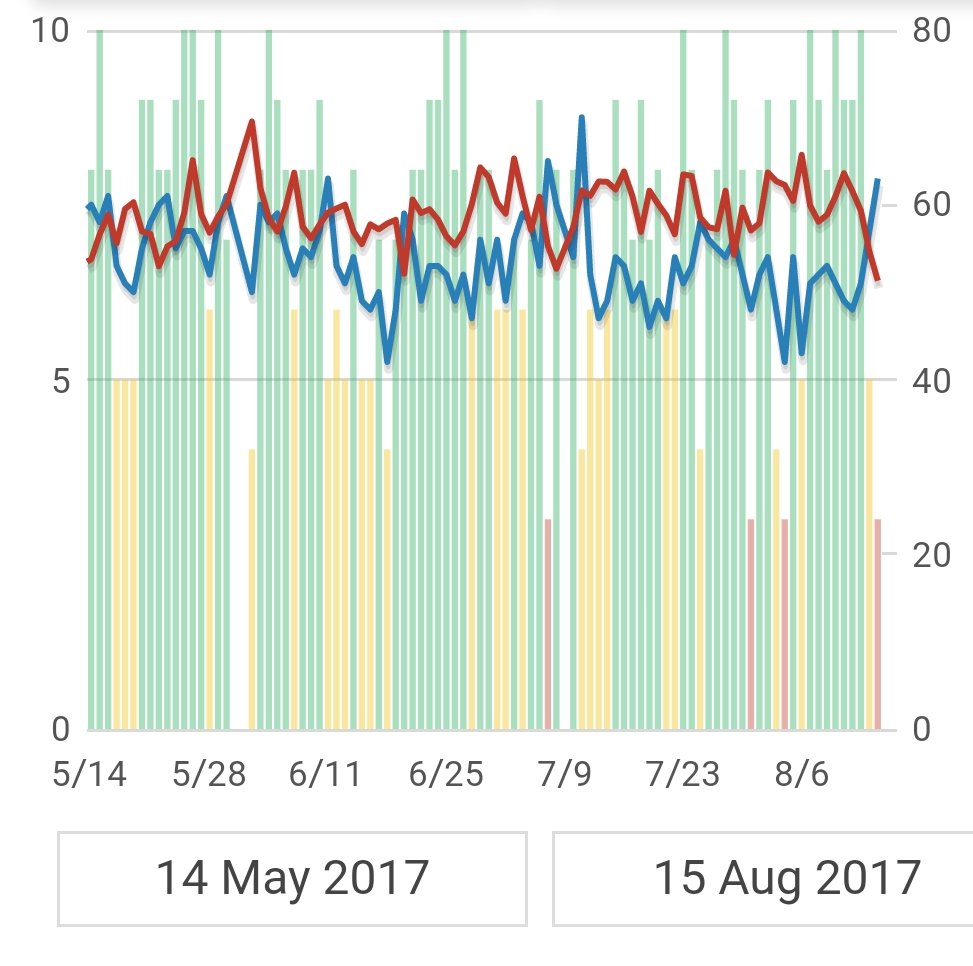
Red zone = watch out! I’ve been measuring my hrv for three months now, and in that time I’ve had only four days in the red zone (indicated by red vertical bars in the graph below).

Regardless of whether the red zone is sympathetic or parasympathetic dominant, it is a warning to reconsider any strenuous activity that day and prioritise rest.
However, a bit of interpretation and understanding of your own data is warranted. For instance, one of my red days was after a period of several days of low hrv, which had drawn my baseline hrv down. Then I finally had a day when my hrv was back in my normal optimal zone – but this was the day that the app said was a red day, because my hrv was elevated compared to my recent baseline. On this day, I was able to refer to my long- term (“lifetime”) baseline and see that my hrv was back in the normal zone. I also felt like I was able to handle more stress.
In a similar vein, after a period of low hrv your recent baseline will reduce, and the app may say that you are having a green day because your hrv is similar to your recent baseline. In this case, again you should compare to your long- term baseline and consider whether you really are ready to handle more stress.
Heart rate variability and resting heart rate
After three months of collecting data, I have started to see a pattern between hrv and resting heart rate. You can check this out in the graph above, where hrv is the blue line, and resting heart rate is the red line. Quite often, if my hrv is low then my resting heart rate will be higher, and vice versa. This relationship is most obvious in the one- off days when hrv is low then recovers the next day. However, for the multi- day periods when hrv is low, resting heart rate doesn’t always show up this trend.
Benefits of hrv
Using hrv tracking, I’ve started to see the times when my body is under more stress and I need to incorporate more recovery:
- the second day after a high intensity training session
- when I’ve got my period
- when I’ve had a really crappy sleep
- when I’m feeling fatigued or like I’m fighting a cold
I have started listening to my body more. I take rest when I need to. I’ve started doing meditation or breathing exercises regularly to counterbalance my sympathetic nervous system stress response. I’m getting up later so that I can get more recovery from sleep. I’m training less, but more consistently in spite of periods of reduced training when my hrv tells me I need recovery. I am maintaining my fitness and seeing improving results in racing. And most importantly I’m more in tune with my body and how I’m feeling.
It is not all about training less in periods of stress – it is a way to observe stressors that you otherwise may not be aware of or acknowledge, and balance ALL your sources of stress with your training stress.
